
A worrying point in the detail of the 2014 Budget is the way servicing of National Debt is projected to continue to growing from the current 8.8% to 9.6% in the next three years (see our table below). It’s not a bearish call on the Exchange Rate either, as Finance Minister Pravin Gordhan explained in his speech today that only a tenth of the Government’s R100bn in annual interest payments services non-Rand denominated debt. That proportion will edge upwards this year when the country taps its friends in the Middle East with the country’s first sukuk (Islamic) bond.
Overall, debt is projected to stabilise around 45% of GDP in 2016, re-emphasing the Government’s conservative approach in a world where many developed countries are struggling to keep their ratio below 100% (Japan is over 200%). Even so, Gordhan pointed out that to offset the negative impact of the Great Recession, during the last five years South Africa borrowed more than R1 trillion. Put into perspective, this is as much as the country brings in from all tax sources (mainly Individuals, VAT and Corporate tax) in a full year.
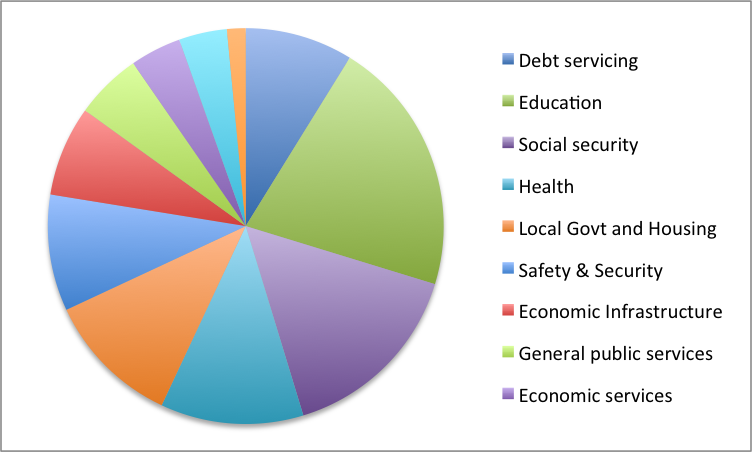
As befits a developing nation, education is the biggest single spending area in the National Budget. The higher debt servicing requirement, though, has resulted in its projected share of the total falling by over half a percentage point in the next three years. Another detail that will concern some is how one of the few sectors targeted for an increase in its share of total spending is social security. This is partly a case of playing catch-up as State old age pensions are a miserly R1 350 a month. – AH
| 12 months to: | Feb-14 | Feb-15 | Feb-16 | Feb-17 |
|---|---|---|---|---|
| Total Spending | 1149.3 | 1252.3 | 1351.6 | 1451.6 |
| Debt servicing | 101.3 | 114.9 | 126.6 | 139.2 |
| Spending after debt servicing | 1048.0 | 1137.4 | 1225.0 | 1312.4 |
| Education | 240.5 | 253.8 | 274.5 | 293.3 |
| Social security | 178.8 | 201.8 | 218.7 | 233.1 |
| Health | 134.3 | 145.7 | 155.1 | 164.8 |
| Local Govt and Housing | 127.2 | 142.9 | 155.5 | 163.5 |
| Safety & Security | 109.3 | 115.7 | 122.1 | 130.3 |
| Economic Infrastructure | 84.7 | 92.8 | 101.2 | 105.0 |
| General public services | 62.6 | 65.1 | 68.6 | 74.1 |
| Economic services | 47.9 | 50.0 | 52.5 | 55.5 |
| Defence | 45.2 | 47.9 | 50.6 | 53.8 |
| Science, Environment | 17.5 | 18.7 | 20.1 | 21.0 |
| % of Spending | ||||
| Debt servicing | 8.8% | 9.2% | 9.4% | 9.6% |
| Education | 20.9% | 20.3% | 20.3% | 20.2% |
| Social security | 15.6% | 16.1% | 16.2% | 16.1% |
| Health | 11.7% | 11.6% | 11.5% | 11.4% |
| Local Govt and Housing | 11.1% | 11.4% | 11.5% | 11.3% |
| Safety & Security | 9.5% | 9.2% | 9.0% | 9.0% |
| Economic Infrastructure | 7.4% | 7.4% | 7.5% | 7.2% |
| General public services | 5.4% | 5.2% | 5.1% | 5.1% |
| Economic services | 4.2% | 4.0% | 3.9% | 3.8% |
| Defence | 3.9% | 3.8% | 3.7% | 3.7% |
| Science, Environment | 1.5% | 1.5% | 1.5% | 1.4% |