
By Matthew Lester
I have never forgotten a presentation made by Gill Marcus some 20 years ago. It was all about the absolute chaos that existed in public finances when we got to the New South Africa. It was all very frightening.
Thus I get really enthusiastic on the release of the annual SARS Statistics report. This is a joint publication of SARS and National Treasury aimed at providing all South Africans with more information about the tax system. It gets better and better every year and is all part of the SARS/National Treasury achievement in being one the most transparent fiscal functions in the world.
In recent weeks there has been much doom and gloom talk around growth rates. And how the forecast for 2014/15 has dropped from 2,5% to 1,4%. So we need some good news.
Tax revenue for 2013/14 was bang on target at R900.0 billion, reflecting year on year growth of R86.2 billion (10.6%). This in itself is a major achievement and an improvement on the 8% compound aggregate growth rate in collections that emerged after the global financial crisis.
The Tax-to-GDP ratio increased from 25.4% in 2012/13 to 26.1% in 2013/14. This is above the long-term average but well below the peak of more than 27% following the financial crisis.
Now for some really good news that gives some hope.
Tax buoyancy, the indicator measures the extent to which tax revenues vary with changes in economic growth, remains buoyant despite tough economic conditions.
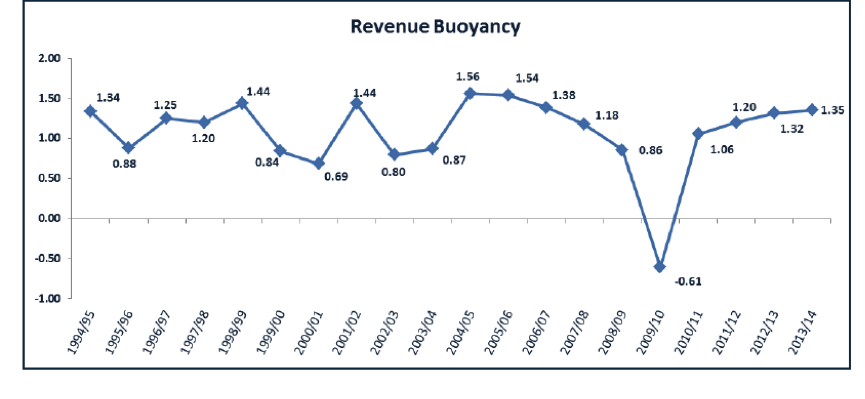
This is a huge relief. Maybe the drop in growth rates will not be as devastating on tax collections as is widely anticipated.
The relative composition of total tax revenue remains little changed.

The big problem that is less than obvious. The decline the relative contribution made by companies ‘CIT’ is often overlooked, declining from 22.9% in 2009/10 to 19.9% in 2013/14. Reduced CIT collections resulted in a higher relative contribution by Personal Tax ‘PIT’ . The contribution of PIT to total tax revenue was 34.5% in 2013/14. The extent of the shift is shown by the fact that while PIT contributed only R28.9 billion more to tax revenue than CIT in 2008/09 it provided R131.4 billion more than CIT in 2013/14.
VAT’s relative contribution increased from 25.7% in 2011/12 to 26.4% in 2013/14.
 Had the CIT trajectory not faltered from 2009 onwards RSA would not be experiencing the national debt problems of today. This is clearly reflected in the following graph of taxes measured to GDP. CIT hit the wall following the Global Financial crisis.
But the SARS stats cannot help us in answering the question of what tax increases are on the horizon for 2015 Finance minister Nene wants an extra R15 billion per annum to start cutting back on the national debt to GDP ratio. We will have to see if the economy runs to expectations between now and February 2015.
 The crunch months for SARS are always November/December tax collections.
If the bonuses and 13th cheques are paid on November/ December and the consumer comes out to play over the festive season that will go a long way towards achieving the revenue targets for 2014/15 and RSA will start the new year on the right foot. But if the consumer sulks at home at a Christmas bring and braai the pressure will surely be on Finance minister Nene in the February 2015 budget speech.
Perhaps it is all up to the kids who make most consumer decisions these days. Despite gloomy economic data the usual consumer frenzy will be driven by nag factor even if bonuses are withheld and Santa stays at home. That’s great for tax collections but lousy for household debt.
Tax students could write some really interesting stuff using the SARS statistical report. All the data is downloadable off SARS.gov.za or treasury.gov.za. So lets continue looking into the SARS stats in a short articles over the next couple of days