
How to spot a bear, or a bull for that matter, is something Dwaine van Vuuren is putting his mind to. They are usually determined post the event when certain markers are triggered but can you catch them earlier? Van Vuuren is trying to debunk this concept, and is monitoring a cocktail of 12 macro, breadth and technical indicators with multi-decade track records, that may warn investors of a bear market on the JSE. His first contribution looked at a lesser known concept called ‘Open Interest’. This week he’s unpacking market breadth, which if in decline is an unhealthy sign for the local market. The article was first published on Sharenet Views. – Stuart Lowman
By Dwaine van Vuuren*
 Market breadth is a technique used in technical analysis that attempts to gauge the direction of the overall market by analyzing the number of companies advancing relative to the number declining each day. It’s a way to “look under the hood” of the stock market internals. Basically, each day we count how many shares went up, how many went down, how many were unchanged in price and the volume associated with these three categories. It’s an interesting concept since each share, no matter how small or large its market capitalization, gets to contribute one vote.
Price changes of large stocks can have a disproportionate effect on capitalization weighted stock market indices, especially the top-heavy JSE, so it can be useful to know how broadly any movement extends into the larger universe of stocks. The way this data is used for trading and investing purposes is a specialized field all on its own, properly documented in a comprehensive manner for the first time in the 2005 Gregory Morris classic: “The Complete Guide to Market Breadth Indicators: How to Analyze and Evaluate market Direction and Strength”.
Almost a decade ago, we had to build our own historical JSE Breadth Database since then, as now, no such thing exists for the general investing public. We also made an important adjustment to our breadth data, removing instruments sensitive to interest rates (such as debt and REITS which have more in common with the bond than stock markets) as well as options, warrants, derivatives and Exchange Traded Funds/Notes (ETF’s and ETN’s) do avoid double-counting. So in a nutshell we have a breadth database (currently 400 shares) that incorporates “Company Only” shares.
Read also: Van Vuuren: Business cycle downtrend ongoing 27 months. Bear market to follow?
The oldest used breadth indicator is called the Advance-Decline Line, or the AD-Line. This is a plot of the cumulative sum of the daily difference between the number of issues advancing and the number of issues declining in a particular stock market index. Thus it moves up when the index contains more advancing than declining issues, and moves down when there are more declining than advancing issues.
The first known written record of the Advance-Decline Line has been traced back to the late 1920s. Although it is simple in both concept and in computation, it has remained a very important tool in measuring the forces of Supply and Demand at work in the stock markets.
![]()
The actual value of the AD Line depends on the starting point for the calculation and is actually irrelevant. In its most basic use, the shape and direction of the AD Line are important, not the actual value. The AD-Line should confirm an advance or a decline trend in the stock market index with similar movements. Bullish or bearish divergences in the AD Line signal a change in participation that could foreshadow a reversal:
- Bullish divergence: AD-Line rising and making higher highs, stock market falling and making lower highs
- Bearish divergence: AD-Line falling and making lower lows, stock market rising and making higher highs
The AD-Line thus gauges the degree of participation in an up or down trend. An-AD Line that rises and records new highs along with the underlying index shows strong participation that is bullish. An AD Line that fails to keep pace with the underlying index and confirm new highs, shows narrowing participation and the inference is that market strength is undermined when fewer stocks participate in an advance.
That ends the lesson for the day – now onto something more important. What is the AD-Line for the JSE telling us right now?
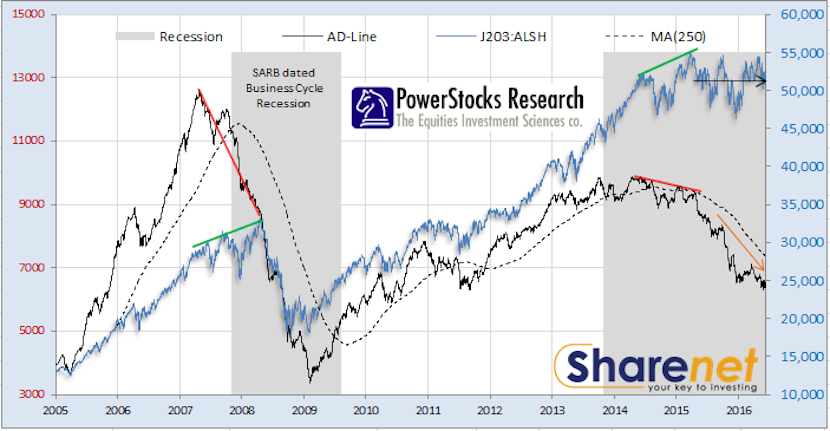
We can make some important inferences from this chart, and they are not peculiar to the JSE, being the same on many world indices.
The first is that the AD-Line always peaks before the stock market. In fact the AD-Line gives far earlier warning of business cycle recessions than the stock market because of this fact.
Secondly, the bearish divergences of the AD-Line and the JSE, marked with red and green lines above hints at high selectivity (or low participation) where fewer and fewer large caps are propping up the stock market – the precursor to a bear market. This phenomenon works exceedingly well in the US, where of the fifteen major bear markets occurring in the 80 years between September 1929 and March 2009, thirteen of the fifteen cases (86.7%) were preceded by several months of significant negative divergence between the Dow Jones Industrial Average and the NYSE AD-Line.
Thirdly, one can take a one year moving average of the AD-Line (dotted line in chart) to determine bear or bull market which in most cases works better than the JSE’s in relation to its 200-day moving average, especially in sideways markets that normally bedevil moving average approaches with whipsaws. This is because AD-Lines rarely get caught up in sideways movements – they are mostly persistently trending up or down.
Finally, note that besides the JSE going basically sideways for the last 18 months, the AD-Line continues declining (orange line). This is really worrisome as it means fewer and fewer shares are propping up the market, which in fact means you can’t hide in the index for safety anymore because its price action is determined by only a handful of probably large cap shares, almost certainly priced at nose-bleed P/E’s. One mishap or earnings undershoot on expectations and these shares are going to get hammered really hard, dragging the index down with it. This is normally how the bear-markets are triggered – there is some external geopolitical or internal political or global financial event or one undershoot on the remaining shares propping up the market and then these shares, often priced to perfection and widely held by the institutions or foreigners, get hammered hard, triggering the bear market. Since breadth is weak, there are no other shares left that anyone is interested in to act as buffer or shock absorber (almost 75% of the JSE is trading below their 200 day moving averages by now) for the JSE and its one-way traffic as everyone unwinds largely held positions – down.
Again, we want to highlight that it is really not wise to base ones’ stock market macro-level (long term) actions on a single indicator such as the AD-Line (since no single indicator is perfect all the time) and that is why we monitor a cocktail of 12 macro-economic, breadth and technical indicators with multi-decade track records of warning of a JSE bear market. Only when a large proportion of this cocktail is flagging a bear market can we safely infer we are indeed in one.
- Dwaine van Vuuren has a BSc(Hons) degree majoring in Computer Science and is a full-time trader, global investor and stock-market researcher. His passion for numbers and keen research & analytic ability has helped grow RecessionALERT and PowerStocks Research into companies used by hundreds of hedge funds, brokerage firms, financial advisers and private investors around the world. He now also heads up retail-side research at Sharenet. An enthusiastic educator, he will have you trading and investing with confidence & discipline.