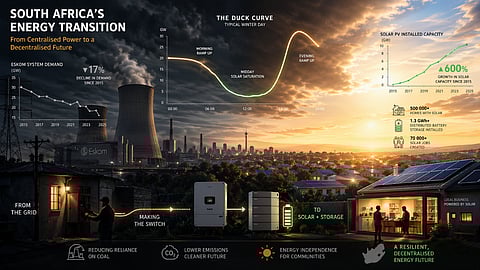
Key topics:Eskom demand falling due to solar adoption; duck curve emergingDiurnal inversion: solar cuts daytime demand; batteries shift load to nightEskom revenue pressure, pricing lag, long-term demand decline & job risks.Sign up for your early morning brew of the BizNews Insider to keep you up to speed with the content that matters. The newsletter will land in your inbox every morning on weekdays. Register here.Support South Africa's bastion of independent journalism, offering balanced insights on investments, business, and the political economy, by joining BizNews Premium. Register here.If you prefer WhatsApp for updates, sign up to the BizNews channel here..By Ir. Wietze Post.Eskom’s daily demand curve has permanently transformed. This change shows that consumers need less energy from Eskom. And they need less every year; the trend is set.Duck curves now frequently appear in Eskom’s supply patterns. The midday dip occurs because more people use solar power, which lowers their need for Eskom's power. Eskom responds by generating less energy. In 2025, Eskom's daytime energy demand on sunny days was thousands of MWh lower than in 2024. This trend continues in 2026 (NTCSA hourly data).The next chart shows the hourly demand of the third Wednesday in March. It shows the third Wednesday’s hourly demand, from midnight to midnight, for six consecutive years..The evening peak was notably low on Wednesday, 18 March 2026 (chart above; lowest line), a pattern often seen in 2025 and 2026. This is likely due to homes and businesses using solar-charged batteries at night. However, these batteries usually do not have enough capacity to meet the demand for the next morning..Read more:.Wietze Post: Wright's Law kicking in- solar, battery prices collapsing.The following charts show how daily demand has decreased since 2021. Each chart shows an entire week, from Sunday morning through Saturday night. Each week is centred on the third Wednesday of the month. Thus, these charts show demand near the summer and winter solstices and the autumn and spring equinoxes.June, the Winter Solstice, 2021-2025:.September, the Spring Equinox, 2021-2025:.December, the Summer Solstice, 2021-2025:.March, the Autumn Equinox, 2021-2026:.The charts show hourly demands from 2021 through 2025, or 2026, as applicable. Since Spring 2025, they show a steady decline in daily demand for Eskom’s energy. Since then, this trend has been clear through the year.Look at the last Friday on the March chart (last chart above). Note that the minimum daytime demand was lower than both the preceding and following nights. This is an example of diurnal demand inversion.The days with diurnal demand inversion are remarkable. Then, more power is drawn from the grid at night than during the day. This occurs because private solar and battery systems meet most daytime needs and thus need less Eskom energy.From October 2024 to the end of 2024, we recorded eight such inversion days. In 2025, there were 18 throughout the year (5 in the first three months and 13 in the last four months). In the first quarter of 2026, we've had 26 such days when SA drew more energy from Eskom at night than during the day.I expect 60 more days of diurnal demand inversion in 2026. In 2027, Eskom may supply more energy at night than during the day for up to 270 days.Eskom probably won't be able to raise regulated night-time electricity prices quickly. As a result, it will lose revenue by selling electricity at a price below its optimal value.Eskom’s management should see the value in supplying electricity when others can’t. This is especially true at night and in winter. Electricity supply is becoming more valuable during these times. Daytime and summer energy, however, are losing value. Eskom should adjust its pricing accordingly.Eskom’s management may find it difficult to acknowledge the company’s long-term decline. Yet, waiting longer to prepare for lower demand will make the transition harsher when it eventually hits.My updated projection, based on all data through March 2026:We will see many near-zero demand hours for Eskom’s energy from summer 2028/29 onward. More precisely, the majority of daytime hours during summer 2028/29 could have near-zero demand (for Eskom’s energy).The centralised grid wasn’t designed for widespread solar generation. It's not prepared for abundant solar plants. The duck curve is not a future concern; it is already present and becoming more pronounced each year.The slow energy transition will have widespread political effects. Slow and reticent decisions and actions will make the situation worse. Eskom’s shrinking role will affect the coal-related industry across the country.The government needs to support job growth in the renewable energy sector. This includes jobs in the electric vehicle-sector. These jobs can accommodate coal-sector workers. However, the government seems unaware of the rapid global changes..Read more:.Wietze Post: Eskom on the wrong side of the S-curve.Eskom’s rapid decline is likely to become evident to the general South African populace by 2029, an election year. Many Eskom and coal-related jobs are likely to disappear over the next few years. The majority of job losses are likely to occur around 2029 and 2030..Other topics in this series:Next: What Eskom, IPPs and Big Business Must Do Now (Before 2029) (Part 5 of 6)Other topics:The Numbers Don’t Lie – Eskom’s Demand is Collapsing – The Data (Part 1 of 6)South Africa is steadily moving away from Eskom, as discussed on 7 and 14 February 2025. This series updates the trends and forecasts I covered in my earlier articles. It focuses on the latest changes and insights..Wietze Post: Data doesn't lie – Eskom’s demand is collapsing.The S-Curve is Here – And Eskom is on the Wrong Side of It (Part 2 of 6)New technologies usually follow an S-curve. Their adoption starts slowly, then quickly picks up speed. In South Africa, solar and battery technologies have entered a phase of rapid adoption. Meanwhile, the demand for Eskom’s electricity is following a downward S-curve..Wietze Post: Eskom on the wrong side of the S-curve.Solar and Battery Prices Are Collapsing – Wright’s Law is at Work (Part 3 of 6)The primary driver of Eskom’s accelerating decline is cost. Eskom is raising its energy prices, while the cost of solar power equipment is going down..Wietze Post: Wright's Law kicking in- solar, battery prices collapsing.Your Electricity Costs from 2026 to 2030 – The Great Divide (End of the series)How much will your monthly electricity cost increase between now and 2030?