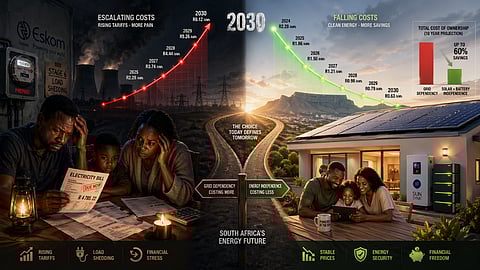
Key topics:Eskom tariffs rising 18–20% by 2027 and 40–60% by 2030Solar and batteries pay back in 2–5 years as costs fallGrid costs surge while solar cuts bills by 60–80% by 2030.Sign up for your early morning brew of the BizNews Insider to keep you up to speed with the content that matters. The newsletter will land in your inbox every morning on weekdays. Register here.Support South Africa's bastion of independent journalism, offering balanced insights on investments, business, and the political economy, by joining BizNews Premium. Register here.If you prefer WhatsApp for updates, sign up to the BizNews channel here..By Ir. Wietze Post.Here’s what really matters for every household and business:How much will your monthly electricity cost increase between now and 2030?Eskom’s average residential tariff is roughly R2.53–R2.80/kWh in 2025/6 (depending on the municipality and tariff). NERSA has locked in an 8.76% increase for April 2026 and 8.83% for 2027. The fixed network and generation capacity charges will rise sharply (up to 75% on some components). (Sources: NERSA decisions Feb 2026; Eskom Tariffs and Charges Booklet 2025/26). The tables below show cost projections for Eskom and municipal clients.Many municipalities distribute Eskom’s electricity and add levies to Eskom’s cost. Thus, municipal electricity can cost significantly more. The second table below shows a cost projection for a municipal electricity customer. You can create your own table by filling in your particular circumstances.In addition to the per-kWh cost, you may incur a separate grid access fee. If you have a prepaid meter, a rental fee may also apply. The higher your electricity cost, the quicker you will get your investment in a solar plant back.If you stay on the grid, your bill will go up. If you don’t change your electricity use, expect a rise of 18 to 20% by the end of 2027. By 2030, it'll increase by 40-60%. Ongoing disputes between Eskom and NERSA could result in even higher prices.Installing solar panels and batteries changes everything. It offers a new perspective..Read more:.Wietze Post: What Eskom, IPPs and big business must do now (Before 2029)..Municipal residential installations pay back in 3 to 5 years. For high-usage homes, the payback is 2 to 4 years. Lower-usage homes may experience longer payback periods. Battery prices reached $70/kWh in 2025 and are expected to continue to decline (BloombergNEF, Dec 2025).Here is a simple payback calculator for a South African household:.By 2030, the distinction will be clear:Grid-only households will face costs 50–80% higher than current levels.Households with solar and battery systems will pay 60–80% less. They can do this while using about the same amount of energy as their neighbours. The key difference is that most of their energy is self-generated, with only a small portion sourced from Eskom.This electricity cost gap is significant. It's expected to widen substantially between 2026 and 2030.Besides a solar and battery setup for your home or business, you can consider water heating. Connecting solar panels to your geyser element is very cost-effective. A DC geyser solar water heating system costs approximately R25,000 and can reduce your electricity bill by 30% to 50%.The financial case for solar energy systems has never been stronger.Data from NTCSA, SAPVIA, and BloombergNEF show that the S-curve is steepening. Prices are dropping quickly for some, but rising for others..Read more:.Wietze Post: Duck curves, day-night inversion and the coming zero-demand hours.The transition is underway. Your electricity bill will reflect your position..Other topics in this series:The Numbers Don’t Lie – Eskom’s Demand is Collapsing – The Data (Part 1 of 6).South Africa is steadily moving away from Eskom, as discussed on 7 and 14 February 2025. This series updates the trends and forecasts I covered in my earlier articles. It focuses on the latest changes and insights..Wietze Post: Data doesn't lie – Eskom’s demand is collapsing.The S-Curve is Here – And Eskom is on the Wrong Side of It (Part 2 of 6).New technologies usually follow an S-curve. Their adoption starts slowly, then quickly picks up speed. In South Africa, solar and battery technologies have entered a phase of rapid adoption. Meanwhile, the demand for Eskom’s electricity is following a downward S-curve..Wietze Post: Eskom on the wrong side of the S-curve.Solar and Battery Prices Are Collapsing – Wright’s Law is at Work (Part 3 of 6).The primary driver of Eskom’s accelerating decline is cost. Eskom is raising its energy prices, while the cost of solar power equipment is going down. .Wietze Post: Wright's Law kicking in- solar, battery prices collapsing.Duck Curves, Day-Night Inversion and the Coming Zero-Demand Hours (Part 4 of 6).Eskom’s daily demand curve has permanently transformed. This change shows that consumers need less energy from Eskom. And they need less every year. Duck curves now frequently appear in Eskom’s supply patterns..Wietze Post: Duck curves, day-night inversion and the coming zero-demand hours.What Eskom, IPPs and Big Business Must Do Now (Before 2029) (Part 5 of 6)..Wietze Post: What Eskom, IPPs and big business must do now (Before 2029).