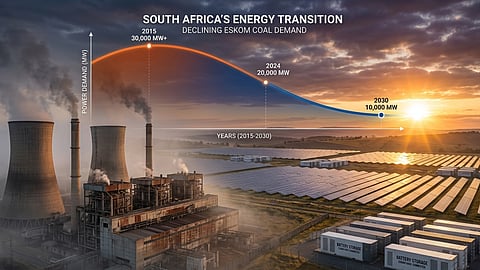
Key topics:Solar, batteries hit rapid adoption phase in South AfricaEskom demand falls sharply, S-curve decline acceleratesProjections show Eskom supply near zero by 2035.Sign up for your early morning brew of the BizNews Insider to keep you up to speed with the content that matters. The newsletter will land in your inbox every morning on weekdays. Register here.Support South Africa's bastion of independent journalism, offering balanced insights on investments, business, and the political economy, by joining BizNews Premium. Register here.If you prefer WhatsApp for updates, sign up to the BizNews channel here..By Ir. Wietze Post*.New technologies usually follow an S-curve. Adoption starts gradually, then quickly picks up speed.In South Africa, solar and battery technologies have entered the phase of rapid adoption.The same principles that lead to rapid adoption also show why older technologies decline. They follow a downward S-curve. This pattern is evident in Eskom’s residual demand.These are the Total Energy Demands that Eskom supplied in the last five calendar years (NTCSA data):2021: 211.96 TWh2022: 211.13 TWh2023: 207.19 TWh2024: 201.24 TWh2025: 191.38 TWh.And here are the year-on-year drops:2022 vs 2021: -0.82 TWh2023 vs 2022: -3.94 TWh2024 vs 2023: -5.95 TWh2025 vs 2024: -9.87 TWh.The annual declines are increasing by approximately 150% (based on the past four years). Projected year-over-year drops (2026–2030) are 15, 22, 34, 51, and 76 TWh. The total of these reductions exceeds the 191 TWh that Eskom provided in 2025. This means Eskom might supply no electricity by the end of 2030.However, Eskom’s declining supply will follow an S-curve. At first, demand dropped with a gradual acceleration. However, over the next four years, it’s expected to decline quickly before slowing down as it levels off after 2030..The chart above shows Eskom’s Annual Residual Demand. The S-curve calculation is based on the data since 2021. The calculation shows that demand for Eskom’s energy will cease in 2035. Thus the annual demand is projected through 2035. The accompanying numbers are shown in the table below:.I predict that Eskom (during the remainder of its lifetime) will generate just 620TWh from April 2026 onwards. This amount should meet consumer demands until Eskom’s plants become redundant in 2036. This total is approximately three times Eskom’s 2024 output. For investment decisions, note that all Eskom investments must be repaid from these 620 TWh. The projection shows that 85% of Eskom’s total remaining generation will be consumed by the end of 2029.Eskom is likely to generate less than 90 TWh in 2029. By the end of 2030, there may be many consecutive days when Eskom supplies less than 5 GW for several hours.In the coming years, Eskom’s daytime power supply, and later its night-time supply, is likely to approach zero. In its final years, Eskom’s Generation Division will likely operate only during winter nights. The Koeberg Nuclear Plant will probably be the last to close..Read more:.Wietze Post: Data doesn't lie – Eskom’s demand is collapsing.This projection is based on an S-shaped curve. We see such patterns when exponential growth meets physical and economic limits. Other technologies have shown similar trends on an S-curve.Other topics in this series:Next: Solar and Battery Prices Are Collapsing – Wright’s Law is at Work (Part 3 of 6).The primary driver of Eskom’s accelerating decline is cost. The cost of solar power equipment is going down, while Eskom is raising its energy prices.Other topics:The Numbers Don’t Lie – Eskom’s Demand is Collapsing – The Data (Part 1 of 6).South Africa is steadily moving away from Eskom, as discussed on 7 and 14 February 2025. This series updates the trends and forecasts I covered in my earlier articles. It focuses on the latest changes and insights.Duck Curves, Day-Night Inversion and the Coming Zero-Demand Hours (Part 4 of 6).Eskom’s daily demand curve has permanently transformed. This change shows that consumers need less energy from Eskom. And they need less every year. Duck curves now frequently appear in Eskom’s supply patterns.What Eskom, IPPs and Big Business Must Do Now (Before 2029) (Part 5 of 6).Your Electricity Costs from 2026 to 2030 – The Great Divide (Part 6 of 6)How much will your monthly electricity cost increase between now and 2030? .*Ir. Wietze Post has broad research, engineering, and business experience. Wietze currently operates as a project leader. He has advised C&I and NPO renewable energy buyers for several years. The title of Ir is an abbreviation of 'Ingenieur', which is awarded to MSc graduates at technical/engineering universities in the Netherlands. Wietze's alma mater is Wageningen University. Wietze avidly follows energy developments around the world and in South Africa. In this series, he considers how global trends may play out in South Africa.