Bears and Bulls, a bit like a credit rating agencies call, is usually determined after the event is in full swing. Dwaine van Vuuren looks to debunk this myth, and is monitoring a cocktail of 12 macro, breadth and technical indicators with multi-decade track records, warning of a JSE bear market. The first contribution is below, and it takes a look at a lesser known concept called ‘Open Interest’. And while the cocktail makes no sense with only 1 of the 12 elements, this is van Vuuren’s launch pad. An interesting read. – Stuart Lowman
By Dwaine van Vuuren*
 In my recent round of countrywide seminars I covered “The 12 signs of the Bear” that show clients what warnings to look for of upcoming bear market in SA stocks.
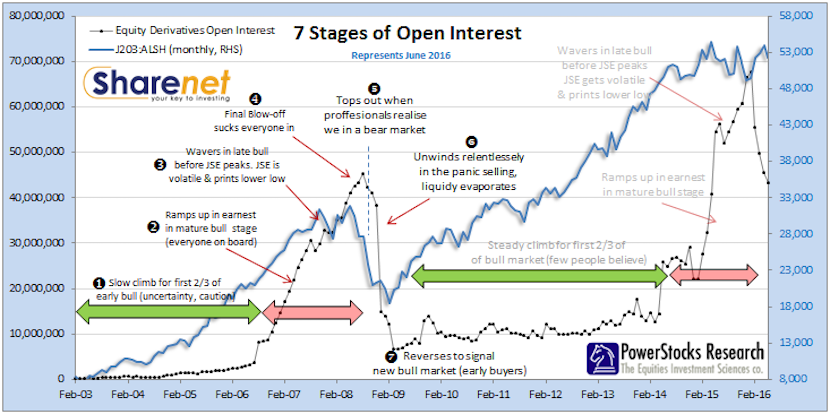
One of the lesser known warning metrics is “Open Interest” which is the total number of options and/or futures contracts that are not closed or delivered on a particular day. Open Interest is therefore the total number of outstanding contracts (long or short) that are held by market participants at the close of the day’s trading. It can also be defined as the total number of futures contracts or option contracts that have not yet been exercised (squared off), expired, or fulfilled by delivery. Open interest measures the flow of money into the futures market.
Increasing open interest means that new money is flowing into the market and the result should be that the present trend (down or up or sideways) will continue. Falling open interest means the market is liquidating and implies the prevailing market trend is ending. A leveling off of open interest following a sustained price advance is often an early warning of the end to an up-trending or bull market.
We track equity-only open interest (excluding commodities) actively for our PowerStocks clients and the reading as at end of June is shown below.
We are witnessing the first large-scale sustained liquidation of open interest on the JSE which implies danger ahead.
Although the JSE seems to be going sideways (and not down as one would expect) we should bear in mind that the JSE in Dollar terms has experienced a recession-class collapse of 45% since its peak on August 2014. The reason we did not see this on the JSE priced in Rands is because of the massive 59% depreciation of the Rand during this time from R10.56 to R16.83 to the Dollar. Also propping up the JSE was a flight into the Rand-hedge large caps, since effectively, without having to do anything, the foreign earnings-per-share of these stocks rose 59% (in Rand terms).
But this does not mean the JSE is not in danger of a collapse in Rands, since the flight to large-cap Rand-hedges has created a toxic combination of high valuations and severe selectivity (weak market breadth) as we discussed in our prior note “JSE Valuations now in unchartered territory”.
Of course, it is really not wise to base ones’ stock market actions on a single indicator such as Open Interest (since no single indicator is perfect all the time) and that is why we monitor a cocktail of 12 macro, breadth and technical indicators with multi-decade track records warning of a JSE bear market.
- Dwaine van Vuuren has a BSc(Hons) degree majoring in Computer Science and is a full-time trader, global investor and stock-market researcher. His passion for numbers and keen research & analytic ability has helped grow RecessionALERT and PowerStocks Research into companies used by hundreds of hedge funds, brokerage firms, financial advisers and private investors around the world. He now also heads up retail-side research at Sharenet. An enthusiastic educator, he will have you trading and investing with confidence & discipline.


