
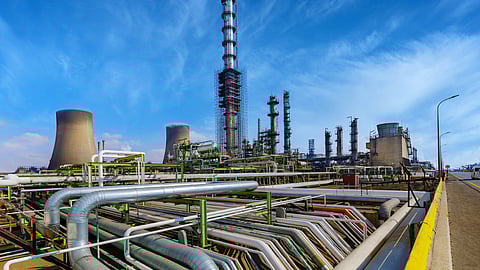
Sasol streamlines business, sees volume improvement across operations
*This content is brought to you by Sasol
- Mining productivity up 3% – full potential benefits offset by safety and operational challenges in H1
- Mozambique gas production up 6% – Additional PPA wells and PSA contributing to higher production
- Secunda production up 1% – Phase shutdown and improved operational performance
- Chemicals Africa sales volumes up 2% – Phase shutdown and improved supply chain
- Chemicals America sales volumes up 3% – Higher utilisation rates
- Chemicals Eurasia sales volumes up 3% – Slight improvement in demand; margins remain under pressure
- Adjusted EBITDA down 9% to R60,012 billion
- The final dividend passed, resulting in a full-year dividend of R2
Johannesburg, South Africa – Sasol's financial results for the year ended 30 June 2024 were negatively impacted by challenging market conditions, with continued pressure from constrained margins and depressed chemicals prices resulting in turnover of R275,1 billion being 5% lower than the prior year. However, these factors were partially offset by the stronger rand oil price, improved refining margins, reduced total costs and higher sales volumes. Additionally, Sasol's stronger operational performance in the fourth quarter contributed to an overall stronger performance in the second half of the year.

A loss before interest and tax (LBIT) of R27,3 billion was incurred compared to earnings before interest and tax (EBIT) of R21,5 billion in the prior year. This decline was mainly due to increased asset impairments, lower earnings before interest, tax, depreciation and amortisation, translation losses and reduced derivative gains.
An impairment loss of R56,7 billion net of tax (R74,9 billion gross) was recorded, mainly relating to the following impairments:
- Chemicals America Ethane value chain (Alcohols, Alumina, Ethylene Oxide, Ethylene Glycol and associated shared assets) cash-generating unit (CGU) of R45,5 billion net of tax (R58,9 billion gross). External conditions, including prolonged softer market pricing and outlook primarily drive the impairments;
- A total of R3,9 billion net of tax (R5,3 billion gross) relating to the Chemicals Africa Polyethylene, Chlor-Alkali & Polyvinyl Chloride, and South African Wax value chain CGUs, of which R0,9 billion net of tax (R1,2 billion gross) was impaired at 31 December 2023. The further impairment at 30 June 2024 relates to the Polyethylene CGU due to oversupply and reduced demand in the global market. The South African Wax value chain CGU remains fully impaired, and
- Secunda liquid fuels refinery CGU of R5,7 billion net of tax (R7,8 billion gross), which remains fully impaired at 30 June 2024.
The prior year included impairments of R33,7 billion (gross) mainly due to the Secunda liquid fuels refinery CGU (R35,3 billion), South African Wax value chain CGU (R0,9 billion), China Essential Care Chemicals CGU (R0,9 billion), offset by a reversal of the US Tetramerisation CGU impairment (R3,6 billion).
| Key metrics | 2024 | 2023 | Change % |
| (LBIT)/EBIT (R million) | (27 305) | 21 520 | > (100)% |
| Headline earnings (R million) | 11 513 | 33 777 | (66)% |
| Basic (loss)/earnings per share (Rand) | (69,94) | 14,00 | > (100)% |
| Headline earnings per share (Rand) | 18,19 | 53,75 | (66)% |
| Interim dividend (Rand per share) | 2,00 | 7,00 | (71)% |
| Final dividend (Rand per share) | – | 10,00 | > (100)% |
| Net asset value | 2024 | 2023 | Change % |
| Total assets (R million) | 364 980 | 433 838 | (16)% |
| Total liabilities (R million) | 217 553 | 232 314 | 6% |
| Total equity (R million) | 147 427 | 201 524 | (27)% |
| Turnover | EBIT/(LBIT)1 | |||
| 2024 | 2023 | 2024 | 2023 | |
| R million | R million | R million | R million | |
| Energy business | ||||
| 28 876 | 27 666 | Mining | 3 210 | 2 580 |
| 12 158 | 11 988 | Gas | 6 703 | 6 432 |
| 118 864 | 118 708 | Fuels | 18 947 | (7 128) |
| Chemicals business | ||||
| 66 883 | 70 586 | Africa | 6 290 | 17 669 |
| 41 805 | 44 942 | America | (61 209) | (543) |
| 42 201 | 48 194 | Eurasia | (2 388) | (1 188) |
| – | – | Corporate Centre | 1 142 | 3 698 |
| 310 787 | 322 084 | Group performance | (27 305) | 21 520 |
| (35 676) | (32 388) | Intersegmental turnover | ||
| 275 111 | 289 696 | External turnover | ||
Dividend
The Company's dividend policy was based on 2,5x to 2,8x Core headline earnings per share (CHEPS). The disconnect between headline earnings and cashflow generation and elevated leverage levels has necessitated a revision to the company's dividend policy.
The Sasol Limited Board of Directors (the Board) approved a change in the Company's dividend policy. The revised policy is based on 30% of free cash flow generated, provided that net debt (excluding leases) is below USD4 billion on a sustained basis. Free cash flow is defined as before discretionary capital spend and dividends paid.
The net debt for 2024 of $4,1 billion exceeds the net debt trigger in the new dividend policy, so no final dividend is declared for 2024, resulting in a full-year dividend of R2 per share.
Read also: