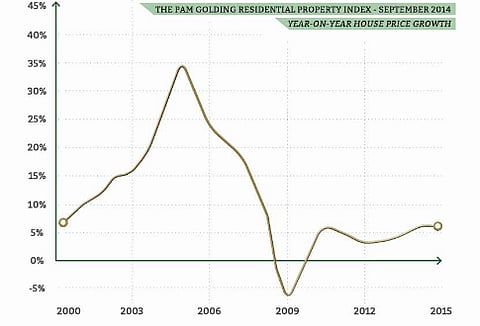
It's time to discard the widely publicised residential property indices produced by Absa and FNB – both of which are limited because they are only based on the banks' own loan data. Enter the Pam Golding Residential Property Index looks at repeat sales which essentially follows the same asset over time. This yields some fascinating results which average sales data indices don't to convey. There is a place for all of them, but its good to understand the mechanics to get the best use of the data. -CP.ALEC HOGG: Well, the Pam Golding Residential Property Index indicates that there has been steady progress in the market since 2009, when we had a decline in property prices. Andrew Golding, the Chief Executive of Pam Golding is in Washington D.C. He joins us on the line now for more. Andrew, the obvious question is 'why do we need another index'. We have Absa. We have FNB. Are they doing it wrong?.ANDREW GOLDING: In our view, there's an internationally accepted protest of repeat sales data as opposed to just average sales data, and so we felt that this index is appropriate to add some information to the South African market..ALEC HOGG: How does it differ?.ANDREW GOLDING: Essentially, what we do is we take repeat sales – in other words, a basket of sales that have transacted more than once – and compare those with each other as opposed to just taking individual sales and averaging them out..ALEC HOGG: So you're looking at the same product or the same asset, as it were, and what's happening to that asset over time. Are you getting assistance from other estate agents?.ANDREW GOLDING: No. Our source of data is a company called Lightstone, which looks across the whole market and then we overlay with our own market Intel, and so it's a Pam Golding Index as opposed to a collaboration with other agents..ALEC HOGG: And clearly, it's a much more comprehensive index from what you've told us with the Lightstone relationship, rather than individual bonds that are granted by either FNB or Absa..ANDREW GOLDING: That's correct and that's essentially, where we've seen the opportunity in that each bank is reporting on their own data and with this index, we're taking a look across the entire market..ALEC HOGG: Nice work, Andrew. Have you back tested it against the other two, and are there many differences in the way that the indices have operated in the past few years?.ANDREW GOLDING: I think the major difference is that the banks' data has this 'top and tail' – the bottom of the market and the top of the market. This looks at an entire cross-section from the bottom end of the entire repeat sales market, right the way up to the top end of the market and so there are some significant differences..ALEC HOGG: So, if I understanding you correctly: in 2005, when we saw a near 35 percent in your index, you would have been a little bit muted in the Absa or FNB Index and similarly, in 2009, where there was a negative five percent..ANDREW GOLDING: That's correct. I suppose that what one is seeing is a more comprehensive view of the swings and roundabout in our markets, which have been quite significant over the last ten years or so..ALEC HOGG: Andrew Golding is the Chief Executive of Pam Golding. I like this one, Gugu. I think it's a lot more sensitive – this House Price Index – and my goodness its volatile. As mentioned there, nearly 35 percent growth in house prices in the year 2005 and minus five percent in 2009. We didn't see that in Absa or FNB so well done to Pam Golding..GUGULETHU MFUPHI: Exactly. It does seem as though they're onto something good there..That's where we leave it for today, here, in Johannesburg, but we will be back tomorrow with more Power Lunch. Not so, Alec?.ALEC HOGG: Indeed, we shall. Let's hope we have another Ketso Gordhan-type interview for you. That was fascinating. Cheerio for now..GUGULETHU MFUPHI: Goodbye, everyone.